N.U.T - UPS Monitoring via PfSense / Grafana

Server owners love electricity, that's why I'll tell you how I monitor my UPS to prevent my servers from shutting down the hard way.
N.U.T (Network UPS Tools) is a good choice to unify multiple brands UPS for monitoring.
I didn't want my hypervisor to assume this role, so I made some research and I saw a PfSense package for N.U.T.
My UPS is a small EATON UPS - MODEL ECO 800.

And it has an USB type B port on the back.
I connect the UPS to my PfSense box (WatchGUARD XTM 525, running PfSense)

PfSense
Package installation
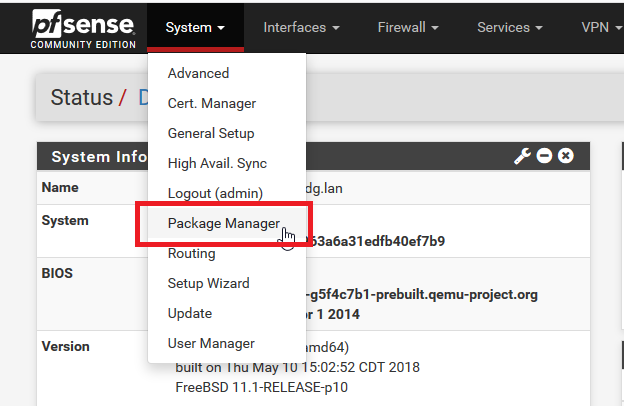
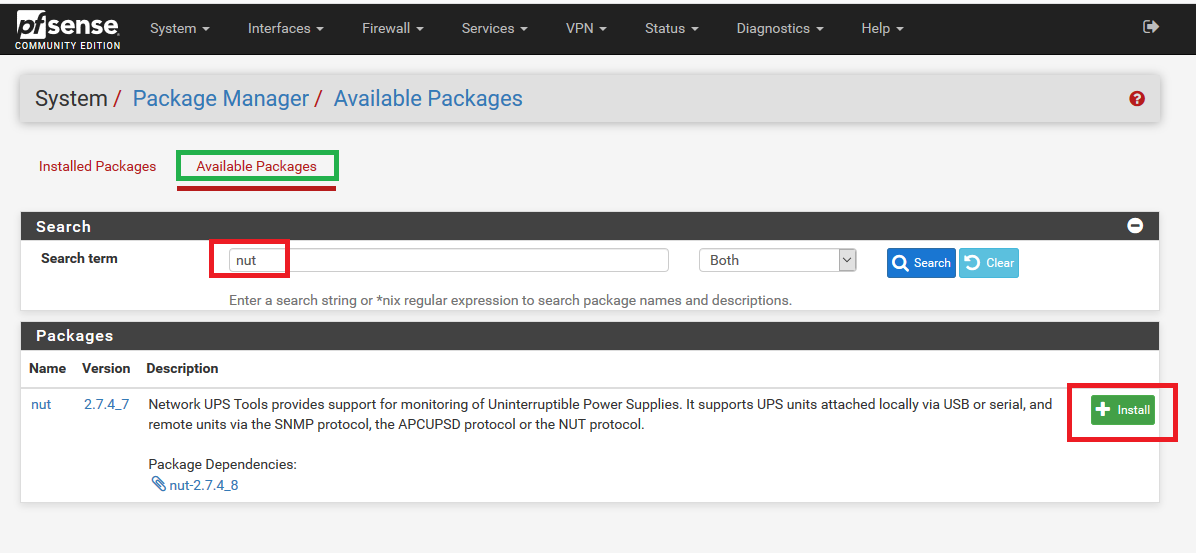
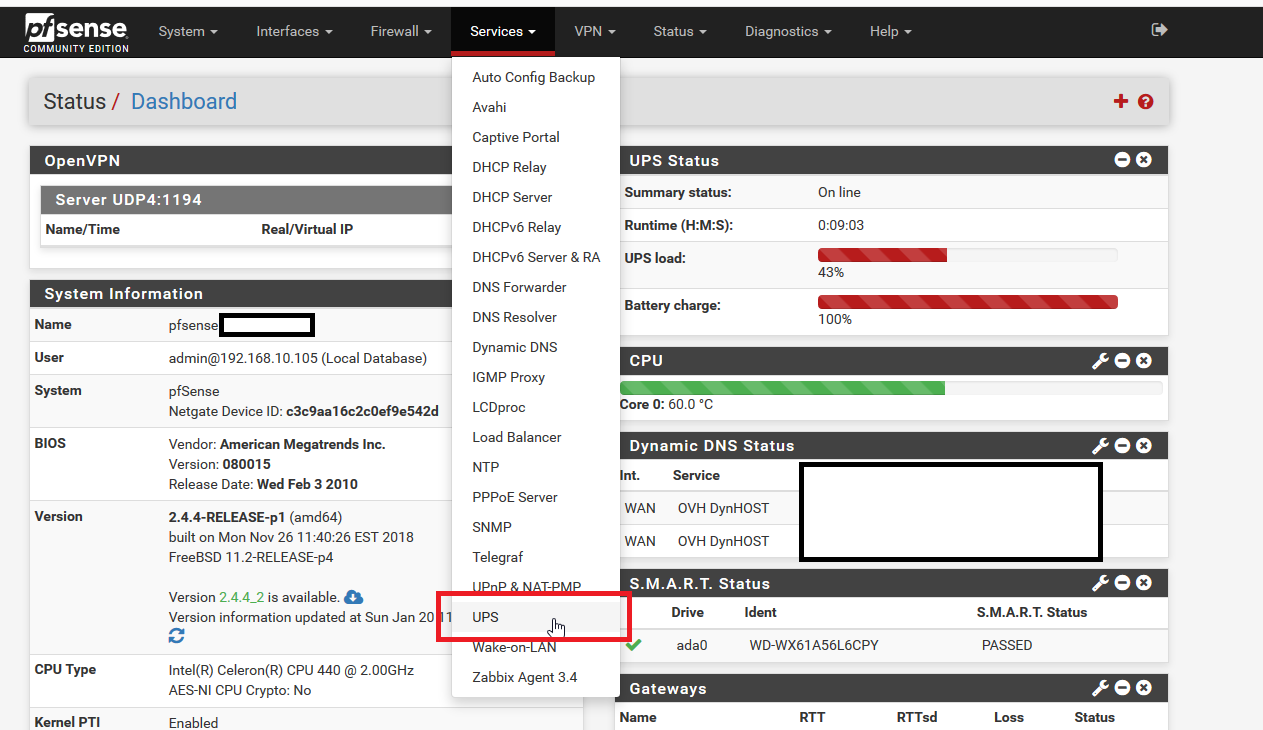
Go to the package manager and search for the nut package
Install it

Configuration
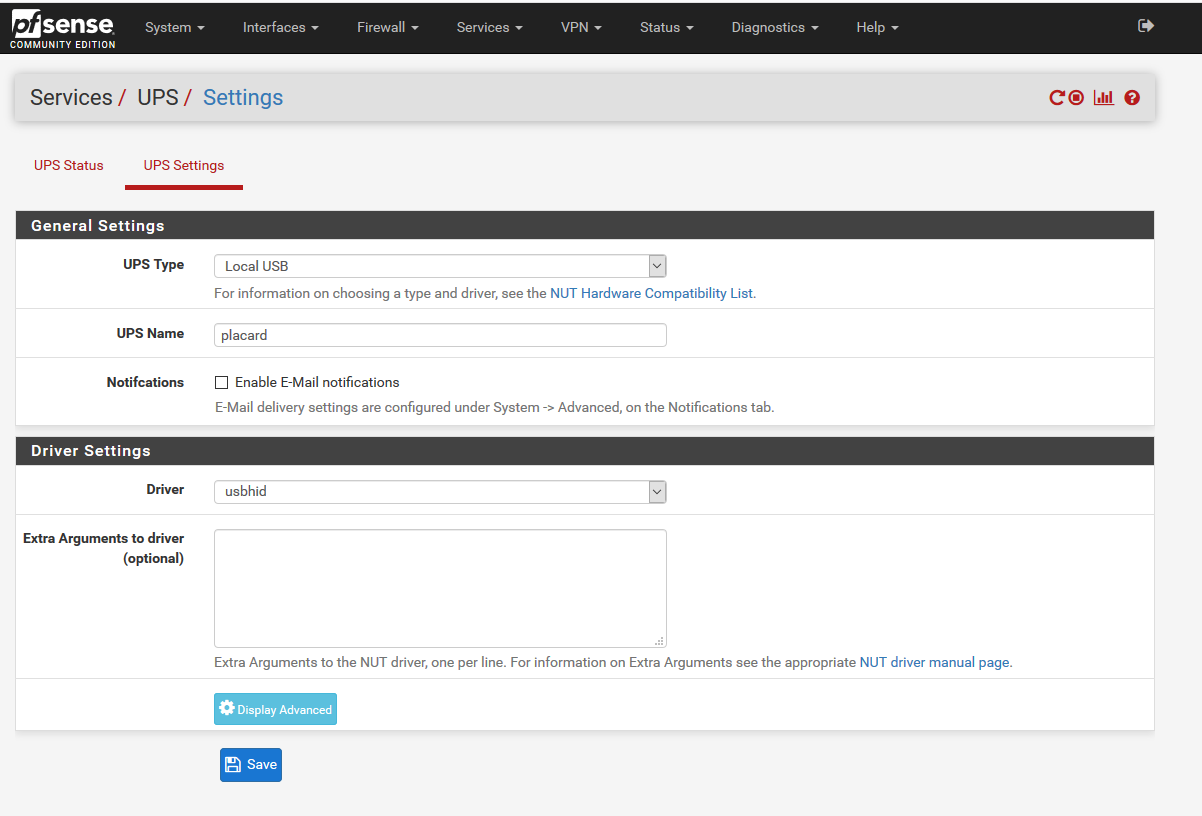
The configuration is quite easy, you just need to go to the settings page of N.U.T, and choose the right driver.
To know which driver you need, the N.U.T team did a hardware compatibility list : https://networkupstools.org/stable-hcl.html
Here's the research for my model

And ... We give a name to the UPS (placard in my case) configure the correct driver, we define the UPS type as USB
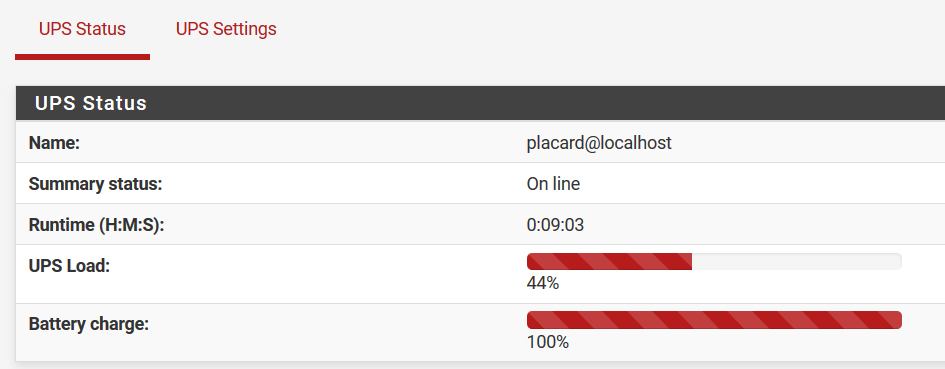
After this, we get back to the UPS status page to see the result

Deeper exploitation
Now, our Firewall know the charge of the UPS, that's pretty nice, but, we could make something more personnal
The installation of N.U.T come with a command line tool called upsc, it displays all the information about your UPS.
upsc [ups_name]@ip_of_the_nut_server
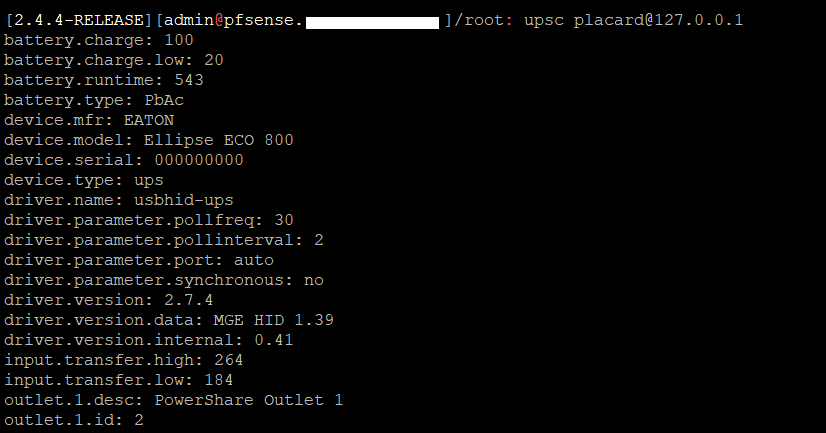
Now, we format the data for exploitation

Grafana integration
For this part, I assume that you have already did a configuration of telegraf in PfSense (if not, refer to my previous guide : https://blog.lbdg.me/pfsense-monitoring/ )
I write a very simple script
filename : ups.sh, localized in /usr/local/etc
#!/bin/sh

charge=$(upsc placard@127.0.0.1|grep 'battery.charge:' | cut -d ' ' -f 2)
load=$(upsc placard@127.0.0.1| grep 'ups.load:' | cut -d ' ' -f2)

echo "ups,ups_name=placard,host=10.0.0.1 charge=$charge,load=$load"
Here's the script in action :
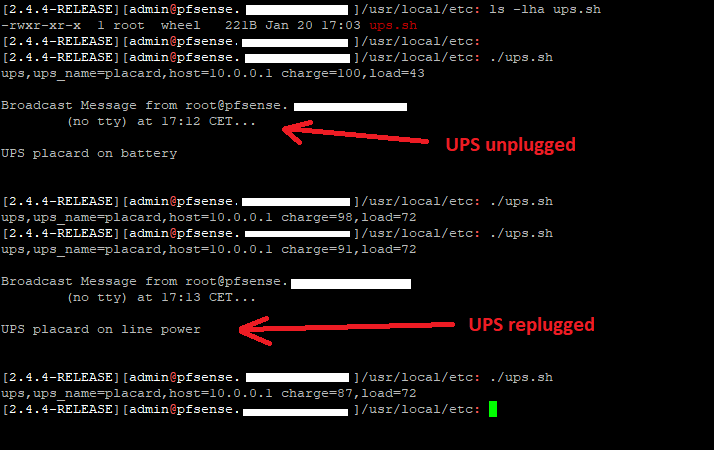
I unplugged the UPS to show you the charge decrease
I create an input filter in telegraf
Configuration add to /usr/local/etc/telegraf.conf
[[inputs.exec]]

        interval = "2s"
        commands = [
                "/usr/local/etc/ups.sh"
        ]

        data_format = "influx"
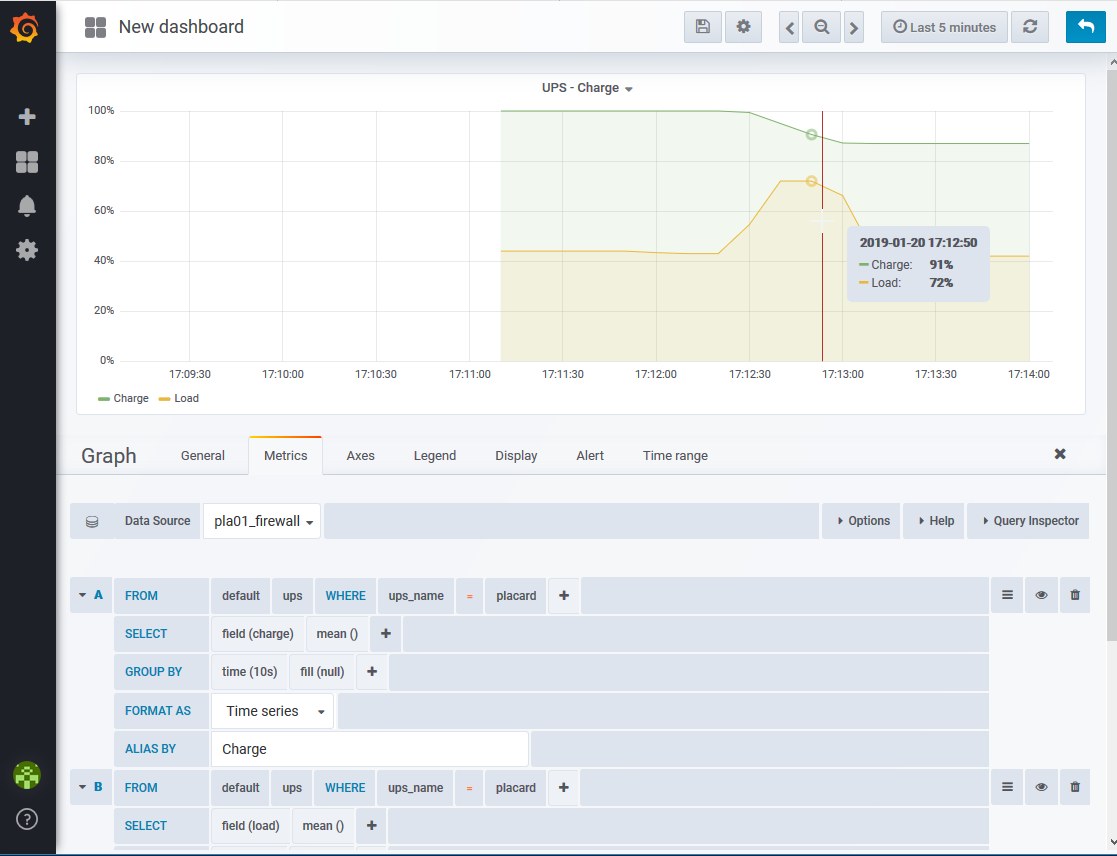
I reload the Telegraf agent and ... Data are coming in InfluxDB, here's a visual representation of the data with Grafana
Zabbix integration
I also have a Zabbix server and I wanted to send a command when the charge of the UPS is lower than a certain percentage.
I use remote commands to extract the data I need
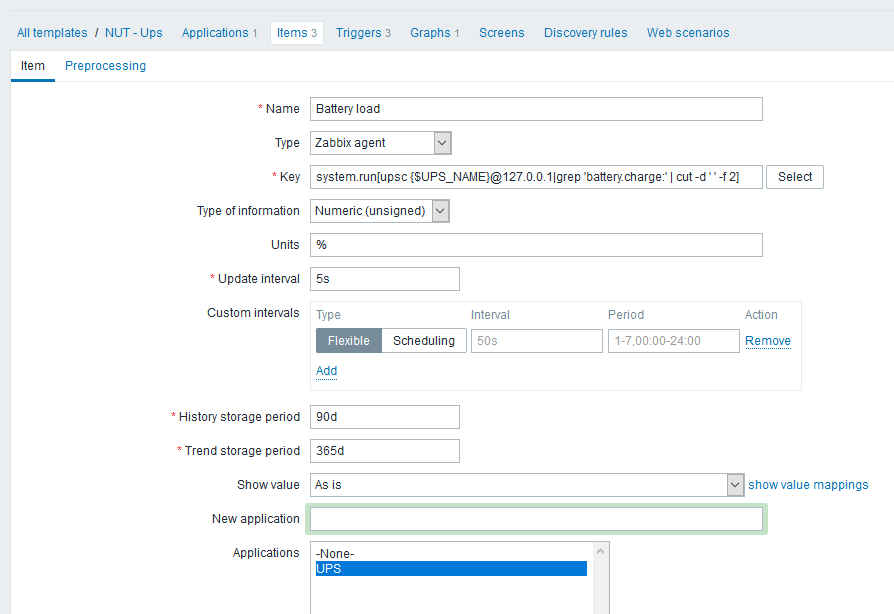
I create 3 items

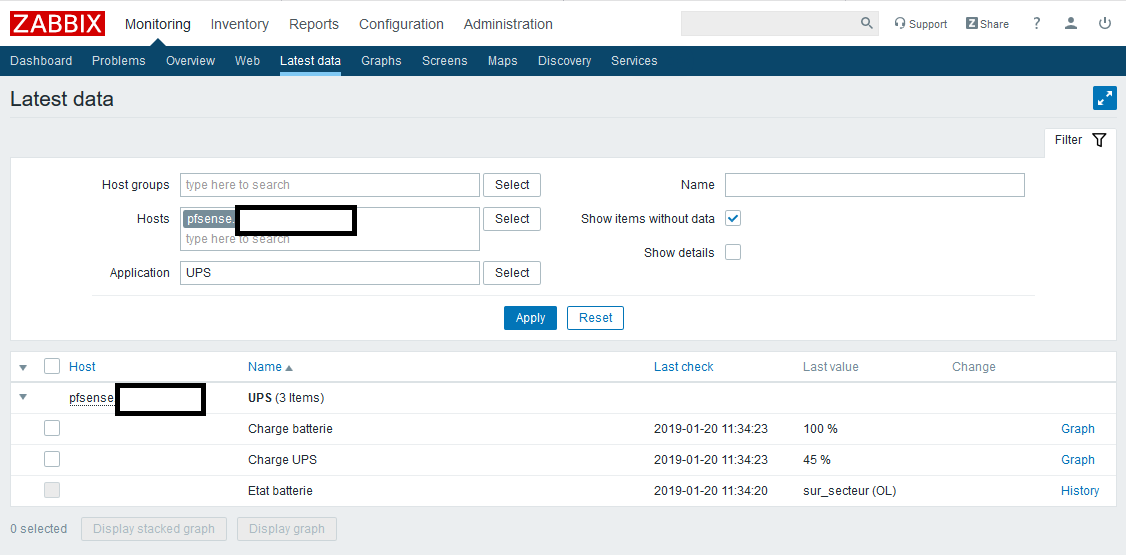
Here's the result
I create a trigger, if the ups.status is different than OL (On Line) and ... You can see a problem "battery connexion"

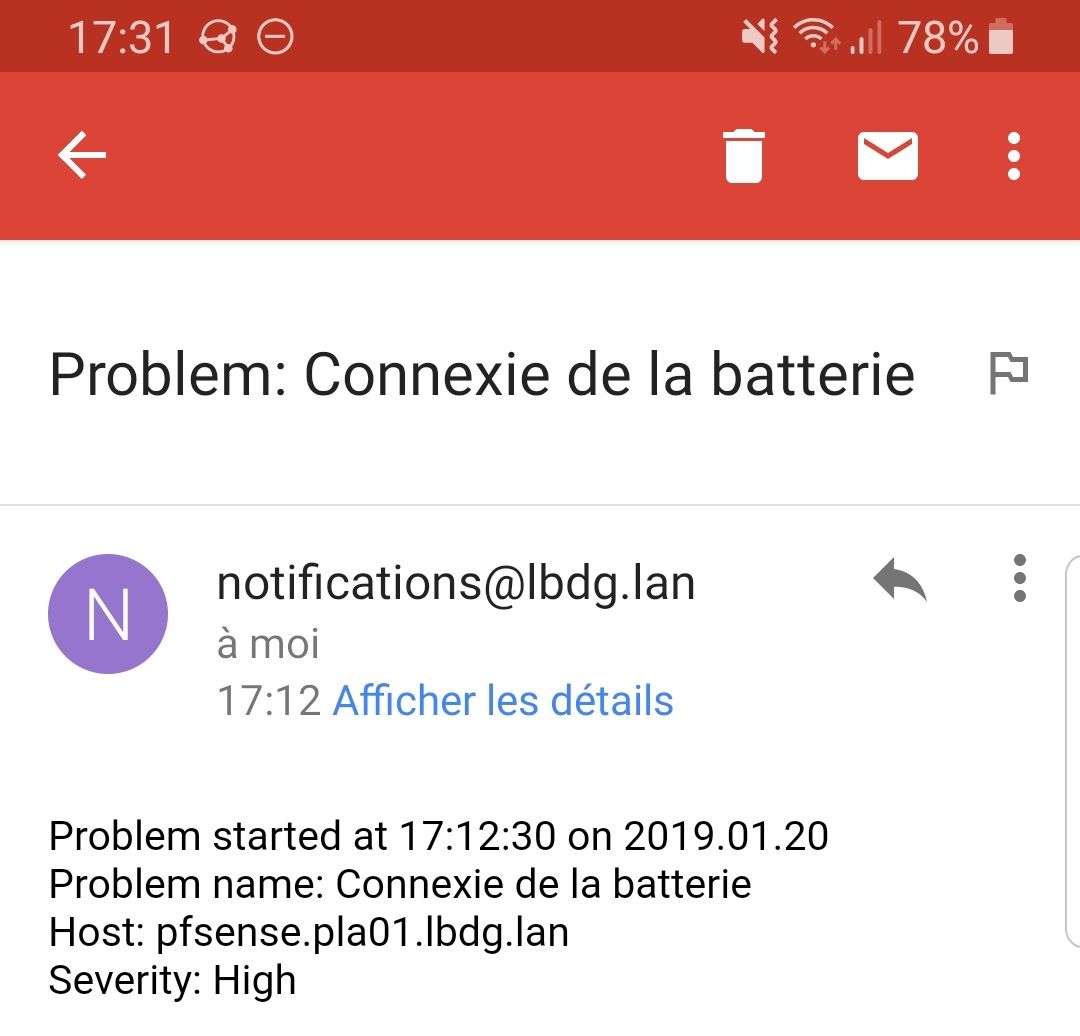
And a mail notification
