🔎 PfSense to InfluxDB - Monitoring


Networks can become kind of cluttery, and there can be lots of interactions between interfaces
- LAN
- WI-FI
- WAN
- DMZ
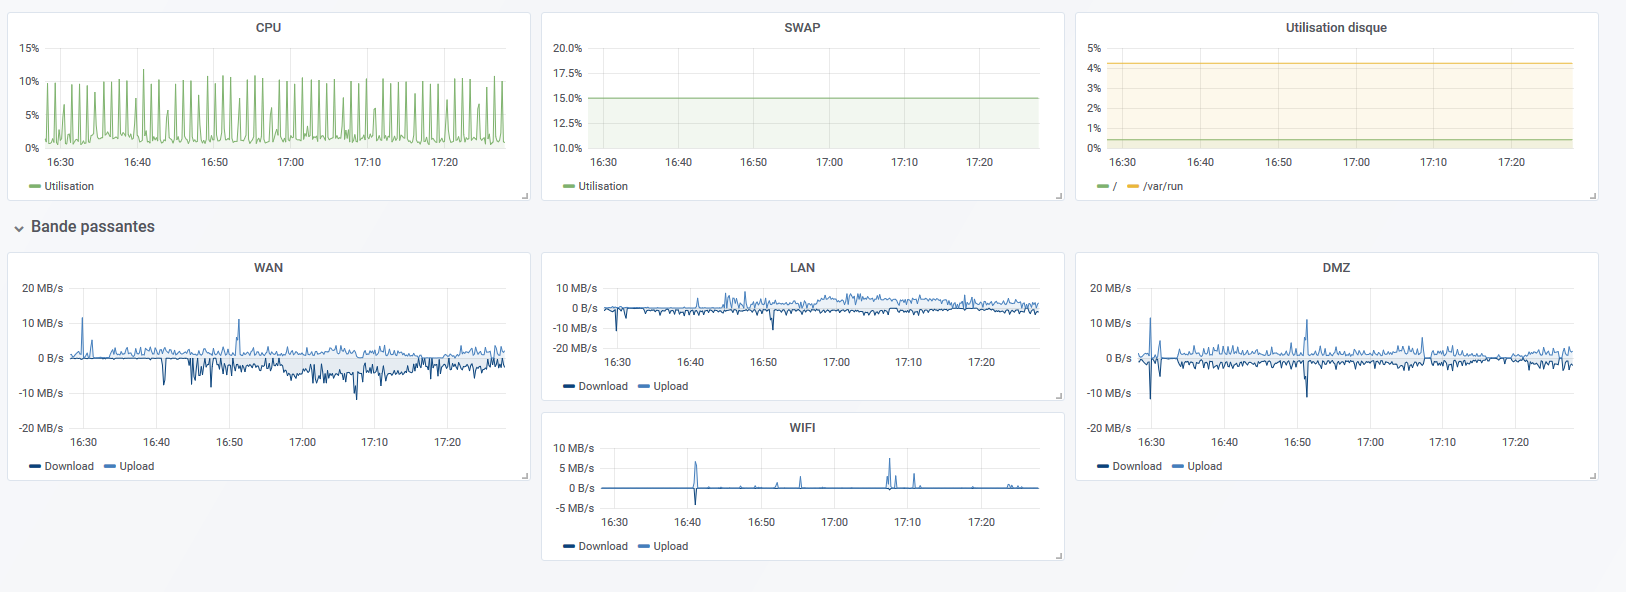
This is why I want to monitor my PfSense via Grafana
Prerequisites
- An InfluxDB server
- A Grafana server and...
- A PfSense firewall!
Installation of Telegraf
A while ago, I installed Telegraf by hand : did a wget on PfSense, installed, enabled and configured the Telegraf service...
I made some research, and found this post on the netgate forum:

I gave it a shot:
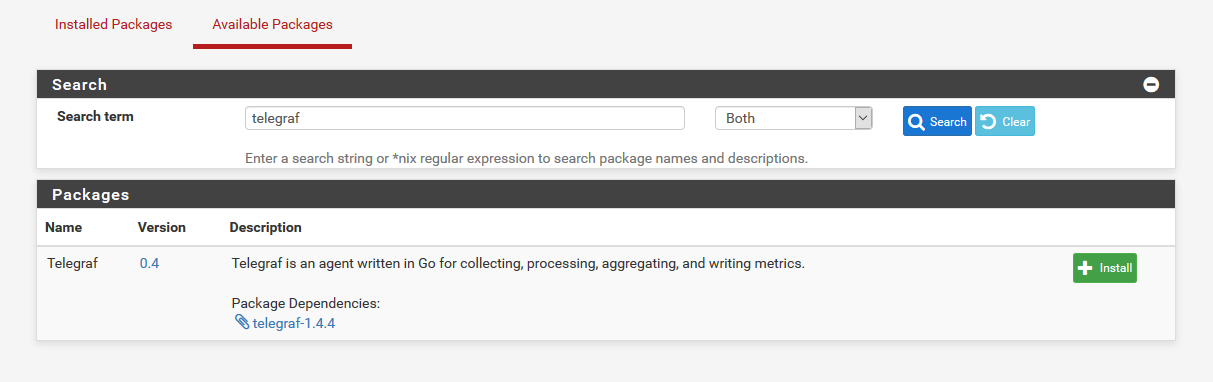
I pushed the install buttton, twice, because I missed. Then I finally click confirm (once). And


Create users and a database in InfluxDB
I created a database named pla01_firewall and two users, one with the read permission for Grafana requests, the other with the write permission for Telegraf to send data in the database
CREATE DATABASE "pla01_firewall";
CREATE USER "pla01_firewall_write" WITH PASSWORD 'WRITE_PASSWORD';
CREATE USER "pla01_firewall_read" WITH PASSWORD 'READ_PASSWORD';
GRANT READ ON pla01_firewall TO pla01_firewall_read
GRANT WRITE ON pla01_firewall TO pla01_firewall_write
Here's the real execution:
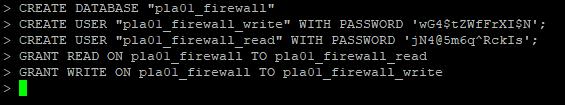
And yes, I changed the passwords.
Telegraf configuration
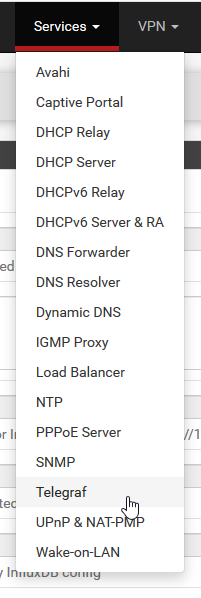
In the PfSense interface go to Services => Telegraf
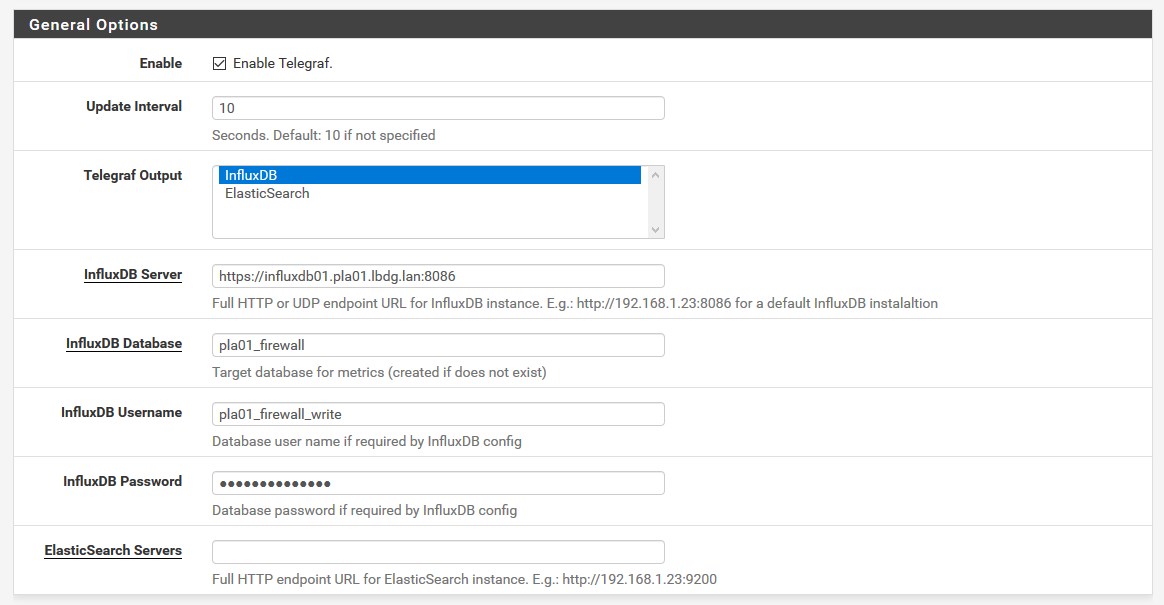
The Telegraf configuration is quite easy, and fields are similar to the text configuration file ones.
Here's the filled version:
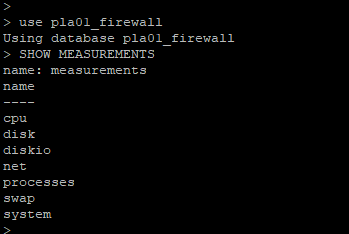
Data received by the InfluxDB:
I encountered trouble because I use a self-signed certificate authority, here's the solution I found : adding CA cert to FreeBSD
Make data prettier
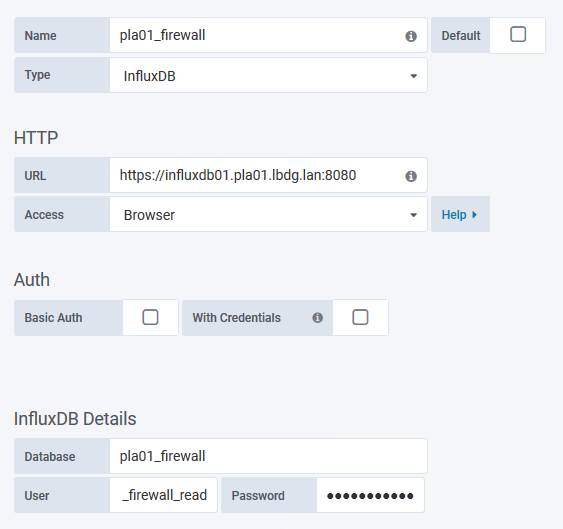
Add the datasource in Grafana:
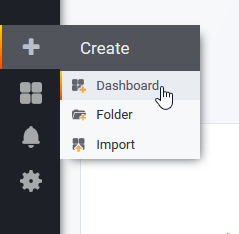
New dashboard for Firewalls
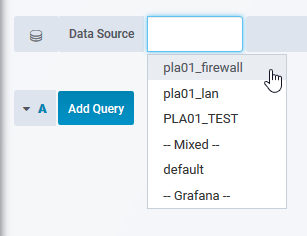
Use the good datasource
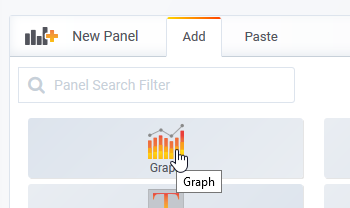
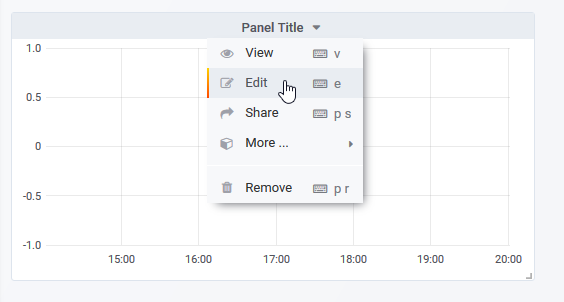
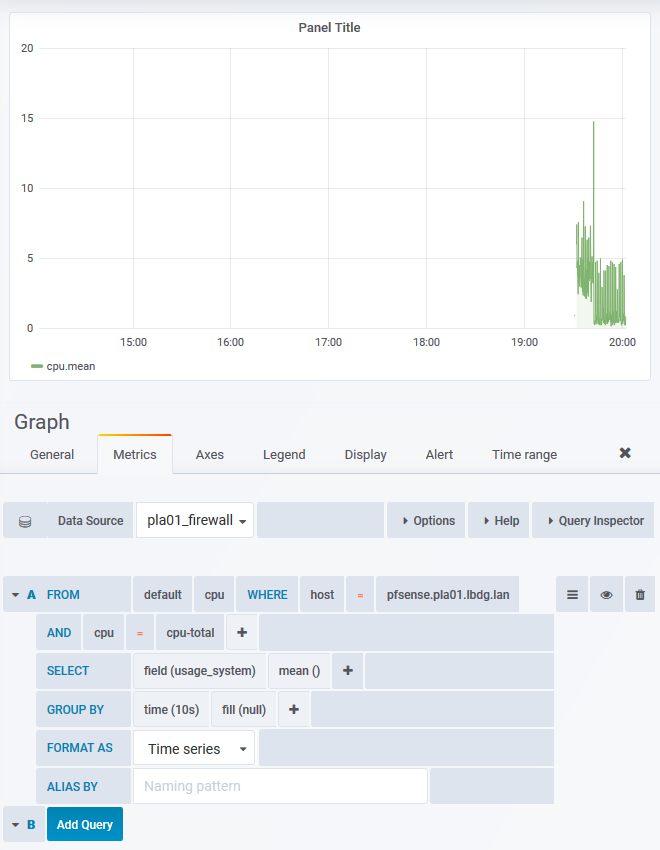
Creation of a CPU graph

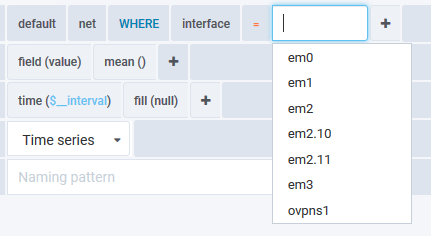
Net interface
Telegraf send data with the interface name :
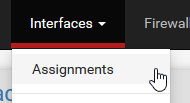
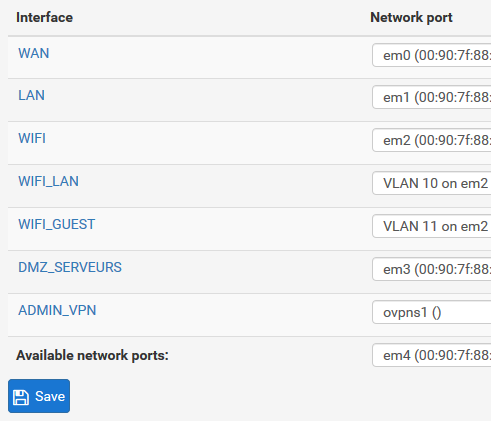
You could have the "translation" in Interfaces => Assignments
Dashboard that is use