Nextcloud - Grafana


Nextcloud to influxDB (Grafana for display) with telegraf.
Nextcloud allows you to see some of your instance statistics by accessing a simple URL : https://instance_dns_name/ocs/v2.php/apps/serverinfo/api/v1/info
To find which one you can use, go on Settings => Administration => System and a section called External monitoring tool
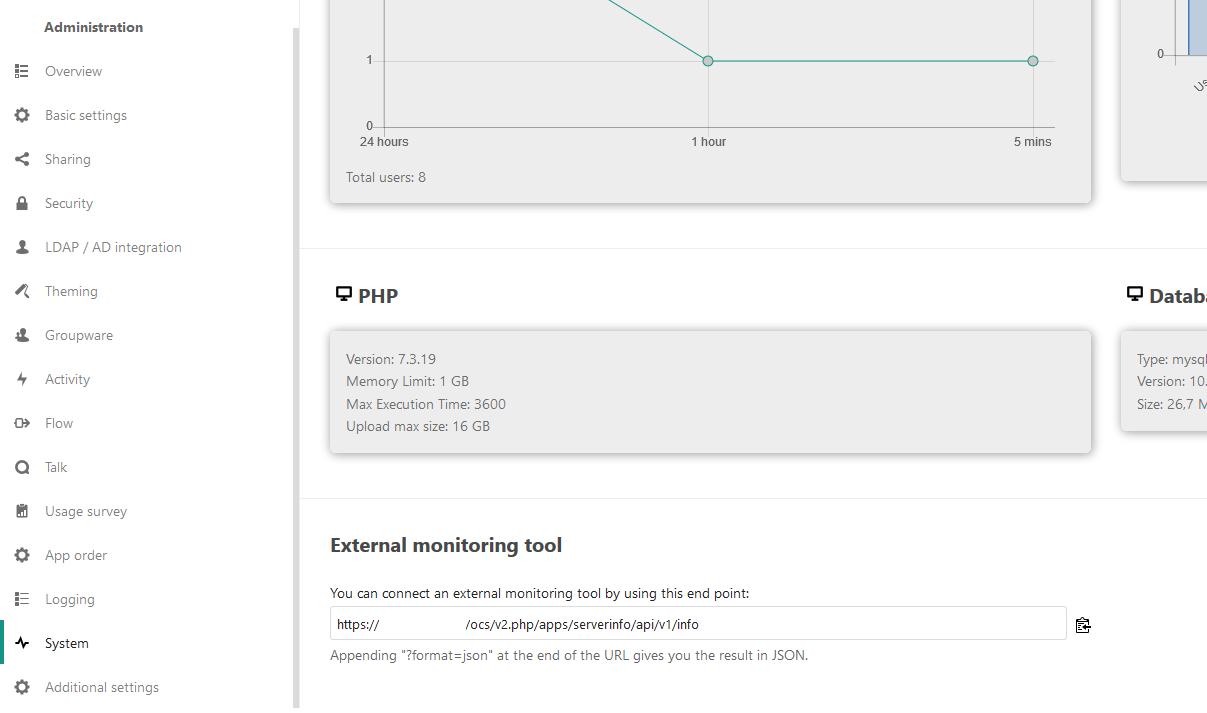
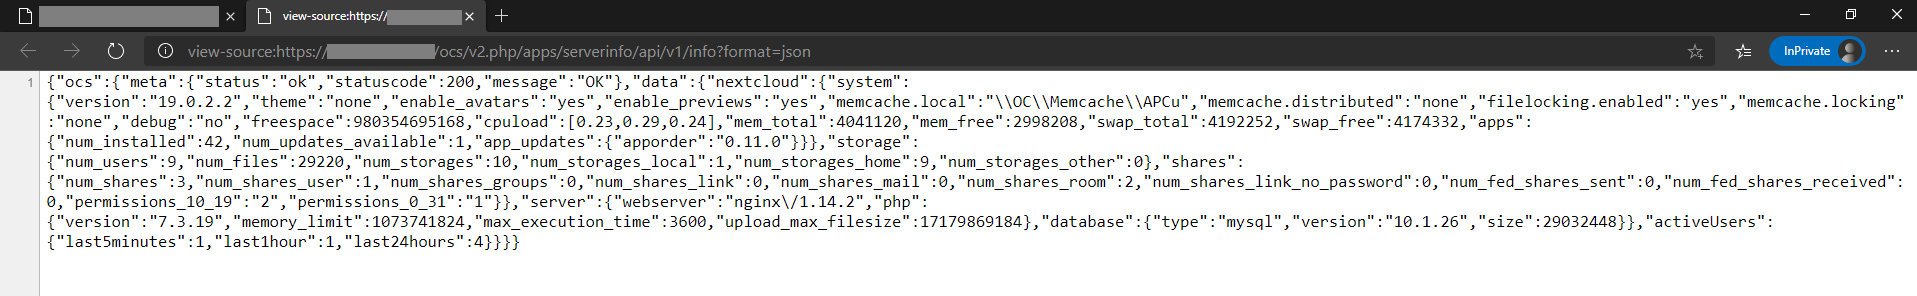
If you append ?format=json to the end of the url, you'll see the data on JSON format. Logged as an admin, that's how datas looks :
Telegraf
At this point, I was wondering : how to get and parse datas. After a little bit of research, I found the input plugin HTTP from telegraf
https://github.com/influxdata/telegraf/blob/master/docs/DATA_FORMATS_INPUT.md
The documentation looks promissing :
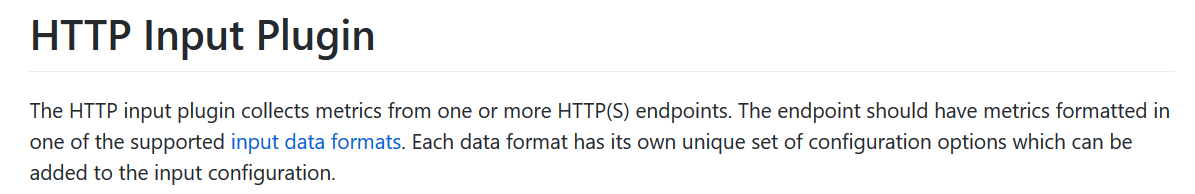
And the JSON format is supported. Successful candidate.
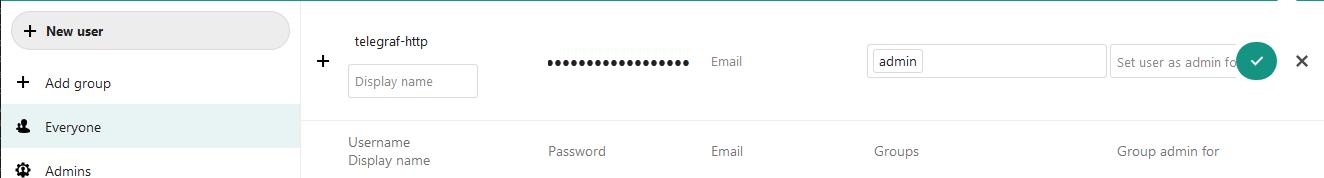
Because we need an admin account, I created one for telegraf, named telegraf-http
Based on the documentation I add a new section on /etc/telegraf/telegraf.conf for http input (all passwords have been re-generated before the publication ;))
[[inputs.http]]

urls = [
    "https://instance_dns_name/ocs/v2.php/apps/serverinfo/api/v1/info?format=json"
  ]

method = "GET"

username = "telegraf-http"
password = "%@R$GVCMRzBJsr#VR4Hm7ngrU$"

data_format = "json"

success_status_codes = [200]
timeout = "30s"
interval= "60s"

name_prefix = "nextcloud_"
And I run a simple test, before reloading, with the command
telegraf --input-filter http --test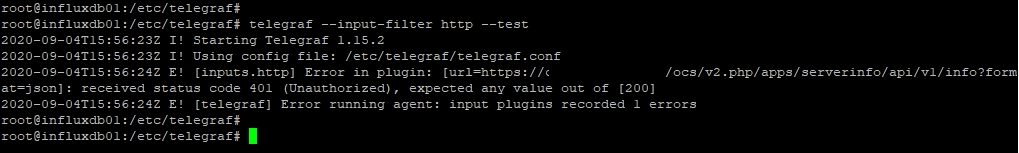
And ... I got an 401 (Unauthorized). It's because I've removed my user telegraf-http from the admin group to test something else before. After re-adding the user, the test looks much better
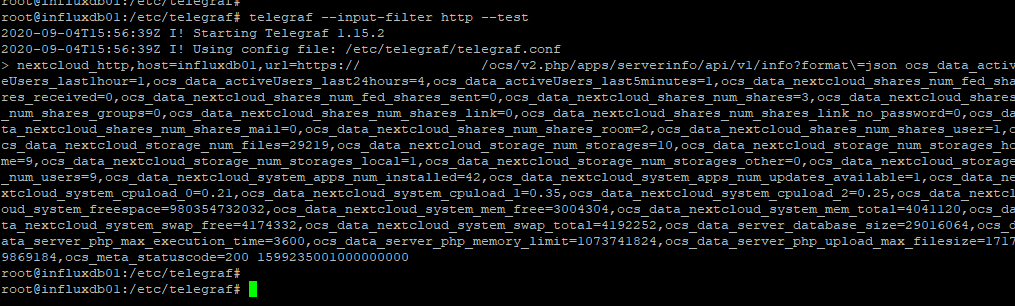
After this I restart the telegraf service to refresh the configuration
/sbin/service telegraf restartGrafana
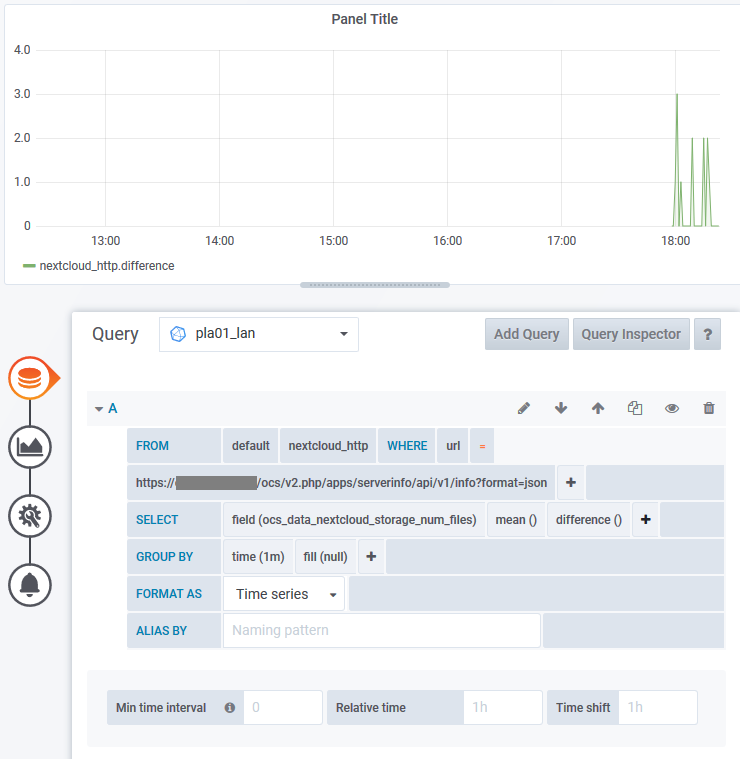
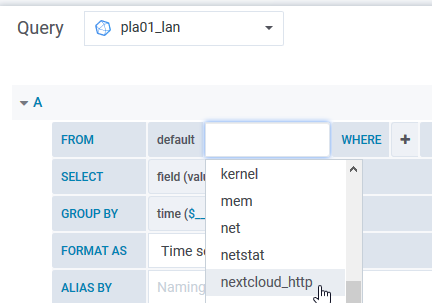
On grafana, I see my new dataset : nextcloud_http
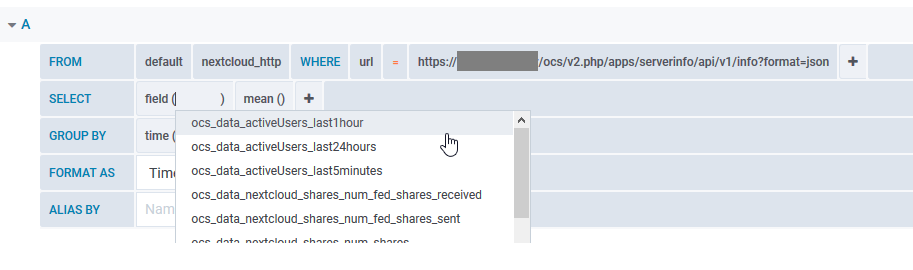
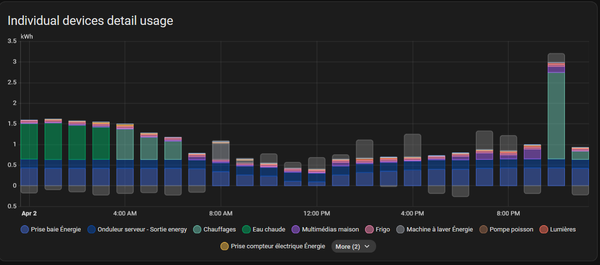
Now, I can create a nice dashboard to follow my Nextcloud activities.
Exemple, ocs_data_nextcloud_storage_num_files with difference transformation. AKA : how many files are added per minutes :